January 2017 Marin County Real Estate Market Report | Market News
Entering the Gates of 8 Woodland Place in Kentfield
Welcome to my January 2017 Marin County Real Estate Market Report. Happy New Year! I hope that you were able to take some time over the holidays to relax and rejuvenate with friends and family. The world of Marin real estate did take a bit of a breather in December on the heels of a slower fall season than the prior year. December is traditionally the quietest month of the year for Marin real estate, and December 2016 was no exception. I was pleased that my listing at 87 Marinita Avenue in San Rafael went into escrow just as I was headed out the door to Le Comptoir for New Year’s Eve. Literally the Lyft driver was arriving as we finalized the deal!
 The numbers are in and once again Decker Bullock Sotheby’s International Realty leads Marin County. For 2016, we were #1 in total volume and units, and the only brokerage that closed in excess of 1000 transactions. We continue to be the luxury market leader, with the highest sales volume at both the $3mm and $5mm pricepoints. For more information, see www.FirstinMarin.com.
I am a big believer in the power of the Sotheby’s International Realty Brand. Read more about Sotheby’s International realty here.
From my own perspective, I had my most successful year in real estate ever, closing the most transactions and highest dollar volume since my career began. Thank you for all of your support! I am grateful to do something I love every day and wake up each morning excited at what the day will bring.
While I am recapping 2016, check out my new article The Ten Most Expensive Homes Sold in Marin County in 2016 if you love looking at beautiful luxury Marin homes. It is worth noting that all of these homes were sold prior to July 2016 when the market began to slow.
The Stunning Living Room of 215 Locust Avenue in San Rafael
Key Takeaways in the January 2017 Marin County Real Estate Market Report:
- For the final quarter of the year, the average active “for sale” price ⬆ increased by 16% while the average sold price ⬇ decreased by 3.7%
- The average price per square foot ⬇ decreased by 1.5% in the last quarter of the year vs. the same quarter in 2015.
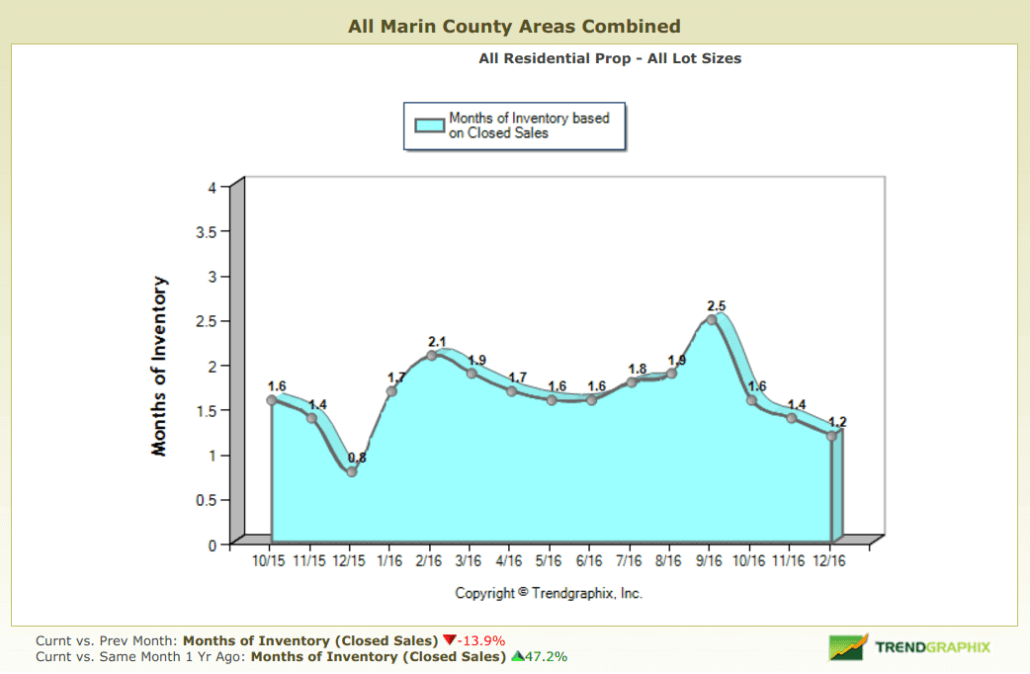
- The months of inventory in December ⬆ increased 47% vs. the same month in 2015 and was up 7.7% vs. the same quarter in 2015.
- The median price of homes sold ⬆ increased 6.7% vs. December 2015 and increased 1.5% vs. the same quarter in 2015.
- The average days on market ⬆ increased to 59 in the final quarter of the year, an increase of 9.3% vs. the same period in 2015.
What Does This Mean For You….
So what do the key takeaways above mean to you? If you’re thinking of selling your home, look carefully at both the increases in inventory (more competition in an admittedly tight market) and in list prices and the decreases in average sold prices. The average sold price may be more impacted by the high end of the market, which has been slowing throughout 2016. Median price, the best determinant of overall pricing, is holding at about the rate of inflation. Bottom line: price your home for this market, not for the market in early 2016 or 2015.
For home buyers, the good news is that more balance is coming to the Marin real estate market, and even though inventories are tight they are better than where they were the same period last year. Look for homes that are well-priced and be prepared to move quickly as the intensely competitive spring market ramps up. Set up property alerts on my website so you can immediately see new homes on the market. (You may wish to read my article Buying a Home in Marin County for more tips and advice.)
“The best time to buy a home is always 5 years ago.”
— Ray Brown
“For Sale” Prices Still Increasing While “Sold” Prices Decreasing

In the chart above, I see a noticeable trend line especially towards the back part of the year. We continue to see “for sale prices” or “list prices” (the green line at the top) increase while actual sold prices have been holding fairly steady. Looking at the increase in asking prices, one might theorize this is due to more luxury homes at higher price points hitting the market. However, if this were the case, one would also expect the see the average sold price rising in a commensurate fashion. It is not, at least so far. As I said last month, “this may indicate that sellers are holding onto the market of 2015 and first half of 2016 and have not adjusted to the trend in the back half of the year.”
I believe this is also due to the slowdown we are seeing in the San Francisco market, which is cooling from its stratospheric highs. I see this as good news — the market is becoming more balanced for buyers and sellers. What happens in San Francisco tends to gently ripple into Marin County’s real estate market, which is less prone to the swings we have seen to the south. Both markets are still driven by strong fundamentals — good job growth and new construction that cannot keep up with the demand. Remember, more than 80% of Marin County has been preserved as open space, which is one reason it is such a wonderful place to live.
Despite the laments of lack of inventory, I have a good number of listings coming on in the spring and summer. Finally, we will have to see how 2017 shapes up — right now there is a lot of uncertainty given the changes in Washington D.C.
Now on to the charts….
January 2017 Marin County Real Estate Market Report: Marin Home Prices List Price vs. Sold

January 2017 Marin County Real Estate Market Report Months of Inventory Based on Closed Sales

January 2017 Marin County Real Estate Market Report Average Price Per Square Foot

I am also now rolling out market update charts for selected towns in Marin. Please click the below for local real estate market updates & charts:
Kentfield Real Estate Market Update
Mill Valley Real Estate Market Update
San Rafael Real Estate Market Update
Tiburon Real Estate Market Update
I am Optimistic About the Future
We live in one of the best places on earth, period. Our climate, cultural activities, outdoor recreational options, and proximity to both mountains and the ocean affords a quality of life many around the world covet. Yes, there is economic uncertainty — as there always has been — with unknowns about interest rates and a stock market than has been on an upward trajectory for almost a decade now. However I believe Marin County and the SF Bay Area are a “blue chip stock” that will continue to increase in value in the long term.
I hope you have found my January 2017 Marin County Real Estate Market Report informative. Please feel free to add your comments, questions or suggestions in the comments section below. If I may be of any assistance in helping you attain your real estate goals, please call or text me at 415-847-5584 and I will be in touch right away. Have a wonderful 2017 everyone!
Please subscribe to my blog to receive my latest articles in your inbox:


Would love to see more on san anselmo… specifically sleepy hollow.
Emaleigh thanks for your comment! I love Sleepy Hollow and enjoy working in the neighborhood. I just happened to be doing a search on larger estates in Sleepy Hollow for a client today and I can tell you in the last half of 2016 when other neighborhoods were seeing reductions, single-level homes on level land continued to go for over asking. For example, 701 Butterfield and 1340 Butterfield both went over asking. 1340 Butterfield sold in 4 days for $200,000 over asking and 701 Butterfield sold for $50,000 over asking and sold quickly as well. If you’d like to talk more about Sleepy Hollow, please call or text me at 415-847-5584. I’m happy to provide any information you might need.
Here’s one of the homes I sold in Sleepy Hollow in case you’re interested: https://www.thomashenthorne.com/711-fawn-drive-san-anselmo-home-sold/
Thank you for your post. This is excellent information.