November 2016 Marin County Real Estate Market Report | Market News

Welcome to my November 2016 Marin County Real Estate Market Report! In last month’s report I reported that the Marin real estate market is taking a bit of a breather with a less-robust fall than some expected. As we are moving into the cool Autumn days (aren’t they gorgeous here in Marin?), the market is continuing to wind down though we did see a bump of sales in October. With those homes now off the market and fewer coming on, we are seeing inventory continue its downward trend. Marin home sellers are beginning to focus on the holidays in November and December and Marin home buyers are also taking their time — there is less inventory now but also much less competition.
Key Takeaways in the November 2016 Marin County Real Estate Market Report:
- October saw a 10.7% increase in average sale price vs. prior month in Marin County for single family homes at $1,530,000 up from $1,386,521 in September. However, average sale price is down almost 6% from the October 2015.
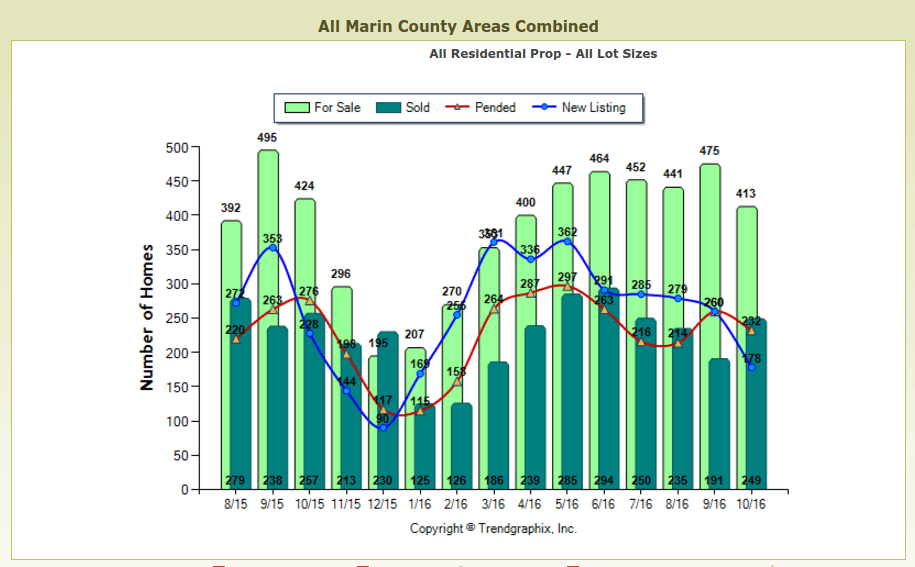
- October inventory in Marin County decreased by 13.1% while sales increased by about 30% vs September. This is the fifth consecutive month of inventory decreases. While the increase in sales vs. September seems high, keep in mind that September was a relatively slow month with only 191 sales closed, vs. 235 and 260 in August and July, respectively.
- Average price per square foot (sold) increased from last month to $686 vs. $647 last month vs. $543 average for all of 2015. However median price, which is less affected by individual sales at high price points, shows that price appreciation is slowing to an 8% increase year-to-date vs. 10% prior year.
- Average list price increased by 11.5% vs. prior month while average sale price increased by 17.2%. Compared to the same month last year, average sold price decreased by 2.3%.
- Percentage of homes in contract: Mill Valley decreased from 30% in September to 22% in October while San Rafael decreased from 46% to 39%, back to where it was in August. The other large market, Novato, increased from 46% to 59% (I tend to ignore the smaller towns in this metric as the percentage can be distorted easily by the relatively few transactions in those towns.)
My business continues to be brisk with some great listings on the market in Kentfield, Tiburon, Mill Valley, San Rafael, and San Anselmo. You can see them all on my Featured Properties page which also includes pocket listings not on MLS. Watch this site or my Facebook page for details on new properties coming to market this fall and next spring.

My Listing at 21 Gilmartin Drive in Tiburon Closed for $6,500,000 in October
In October my listings at 21 Gilmartin in Tiburon and 104 Wimbledon Way in San Rafael closed, for $6,500,000 and $1,218,000. Both homes sold very quickly with a lot of market interest.
I have noticed that buyers are definitely sensing the shift in the market and are taking their time in making decisions, sometimes visiting a property several times (I often offer a twilight showing of my listings so they can see the home at sunset.) Buyers are also in the “remodel or buy” mode, looking to see what they can afford before deciding whether to remodel their homes in the spring or move to a new home.
Decker Bullock Sotheby’s International Realty is the #1 brokerage year to date in Marin County from both from a sales volume ($1.3 billion sold so far this year!) and number of units sold perspective. I continue to be proud of my association with Decker Bullock SIR and believe the power of the brand offers my sellers a competitive edge in the local and global real estate market.
“I’m just learning about the Marin market now and may move from the city next spring.”
— Buyer at one of my open houses
Looking forward…
The Marin real estate market is slowing down for its winter hibernation. I imagine we will continue to see inventory drop significantly until we hit spring. The good news for buyers during this time of year is there’s not as much competition from other buyers, and the good news for sellers is that the buyers who are looking during the holiday and winter months are often very motivated to purchase a home. The number of pocket listings often grows during this time as sellers “soft market” their homes which are technically off-market, preparing for a spring launch.
At the national level…
The rally in US Treasuries set a new record this summer with benchmark 10-year yields falling to an all-time low of 1.32%. Since then mortgage interest rates have slowly trended upward in reaction to strong US job gains and news the Fed will raise rates at their next meeting in December. The Fed last raised interest rates one year ago. Though it began the year with the intention of increasing rates several times, it ended up leaving them unchanged.
However, all signs now point to inflation acceleration as the October jobs report showed a 2.8% rise in average hourly earnings which represented the single strongest reading since June 2009. All told the US economy has experienced 80 straight months of job creation – the longest streak of total job growth on record. Home prices in the United States have recovered nearly all their losses from 2006, which represented the all-time national high. Real housing prices (home prices adjusted for inflation) have risen by 25% since 2012 alone.
Now on to the commentary…
September was surprisingly slow, but October showed a rebounding seasonal uptick. Sales increased from 139 homes to 196, a healthy jump. This absorbed some of the growing inventory. The highest priced sale was $6.5 in October vs. $5 million in September. In addition, there were two sales over $5 million, one in Ross and one in Tiburon, both sold by Decker Bullock Sotheby’s International Realty. Both the Median and Average Sale Price increased.
Inventory levels have been historically low, however, declining sales volume reduces absorption and thus more homes are available relative to the declining sales volume. While October had nearly the exact number of sales as the previous year, overall the number of sales is declining as we seem to be reaching a new level of price sensitivity by buyers. Comparing this year-to-date, January through October, with the same period in previous years we see declining sales in units: 2014 at 2,040, 2015 at 1,938 and 2016 at 1,671 single family home sales in Marin. This is a drop of 18% in the last two years.

While the Average sale price is up, the median price can provide a clearer view of the changes over time, which is less affected by individual sales at high price points. Comparing the January through October year-to-date with the same period in previous years we see price appreciation slowing with Marin single family homes. In 2014, the median selling price was $1,000,500 which then increased 10% to $1,100,000 in 2015. Year to date we have seen an 8% increase in median selling price.
Greenbrae sales are the highest relative to the inventory, and in October, every home was in contract. In contrast, no Ross homes were in contract although there were 9 available. The next most active market was Novato (59%), then Larkspur (56%). The number In Contract in San Anselmo and Kentfield increased from last month to 39% and 33%, respectively. Tiburon, Sausalito and Ross saw decreases with Corte Madera exhibiting the greatest decrease, at 33%, down from 62% in September.

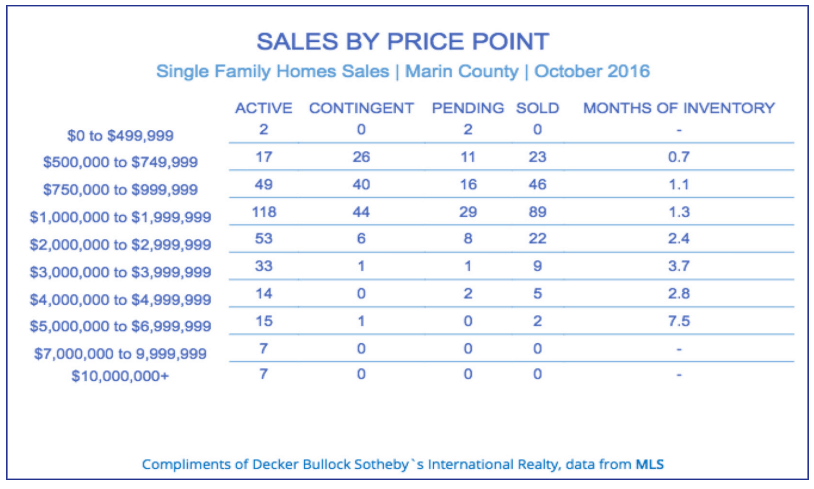
As we look at sales by price point above, we see that the lower end of the market is still turning quickly while the upper end is much slower. We have seen this trend continue all year.
 San Rafael, Novato and Mill Valley continue to see the most homes sold at 52, 37 and 26, respectively, all of which are above September levels. Average days on market ranged from 12 in Stinson Beach to 211 in Belvedere. The majority of homes available were between $1-2 million. As one might expect, in the under $1mm market, which is the strongest market right now, the months of inventory is lowest. There were a total of 29 homes available over $5 million; Decker Bullock SIR represented the only two sales in that price point.

Remember in the last two Marin real estate market reports I said we needed to keep an eye on inventory vs. sales to make sure they’re moving in tandem? September was the first month we saw a significant divergence, with inventory down 4.6% and homes sold down a surprising 29.3%. October inventory was down 13.1% vs prior month and sales were up 30.4% vs. a (very slow) September but down 3% vs. October of 2015. As the mini fall season ends, I believe it is safe to assume that inventory will continue to decline until we hit what we hope will be the big spring 2017 season.

The chart above provides a nice graphic of months of inventory based on closed sales. As you see above, in October 2016 were were running about 6% higher than in October of 2015. If this winter is like last winter, we will see this number come down further, bottoming out in December.
I hope you have found my November 2016 Marin County Real Estate Market Report helpful, and I would be happy to answer any questions you might have. Please call or text me at 415-847-5584, or fill out the below contact form, and I will be in touch right away. Feel free to leave your own comments and observations in the comments section below.
Please subscribe to my blog to receive my latest articles in your inbox:


Thanks for the update and sharing your commentary. We’re ready to see the market spring back!
Glad you enjoyed it, Judy! Hope you and yours have a wonderful Thanksgiving.